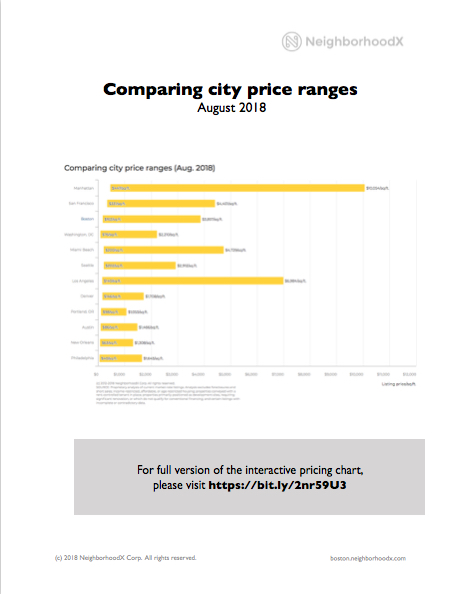
An average asking price for a city
can often conceal a significant
price range. Sometimes, looking at the
lower end of the market can give insight
into the price of an entry-level property,
while the upper end of the market puts the
average asking price in a new context.
With this in mind, we included the borough
of Manhattan rather than New York City
overall. The average asking price for
Manhattan - itself the size of some cities -
by itself puts other cities’ pricing into a new
context. However, New York City overall
would include the lower-priced outer
boroughs, and this would bring the average
price down and would obscure the true
levels of Manhattan pricing.
For Manhattan, prices drop as one goes
further north. Inwood, the northernmost
neighborhood on the island, has the lowest
average asking price, and the lowest-priced
market-rate property here (asking $447/
sq.ft.) offers a pricing floor for the island of
Manhattan. To put this in context, the
lowest-priced property in Manhattan (on a
per-square-foot basis) is the average asking
price in Los Angeles overall ($445/sq.ft.).
The upper end of the Manhattan price
range breaks the $10,000/sq.ft. barrier, and
is reflected in several units at 432 Park
Avenue South.